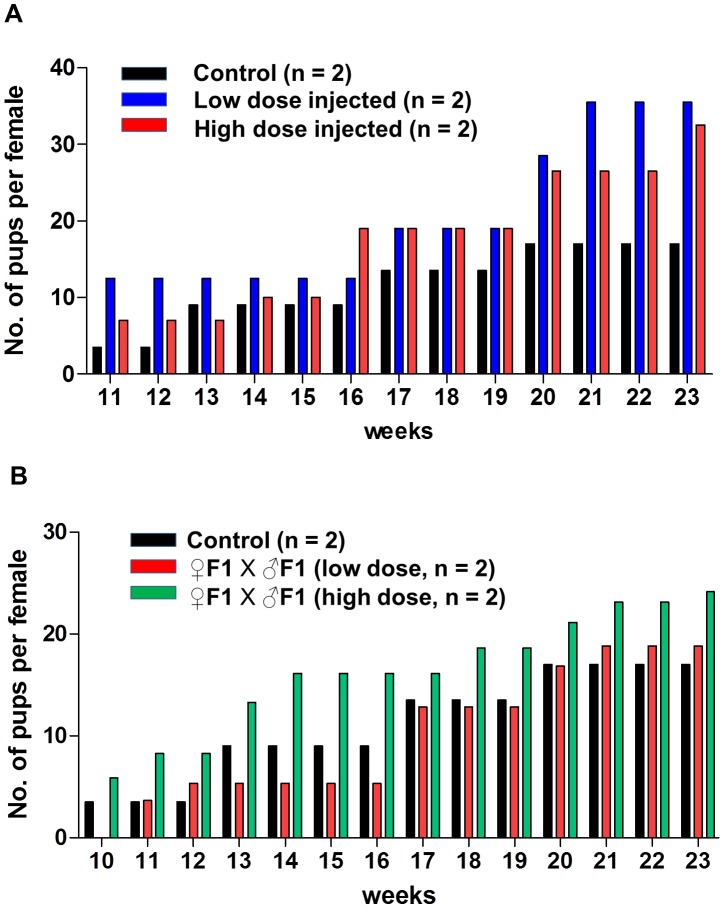
Figure 4. Fertility measurement of the female mice directly injected with bpV(HOpic).
(A) Weekly comparison of the cumulative number of pups for the low dose bpV(HOpic)-injected mice (n = 2, blue bars), high dose-injected mice (n = 2, red bars) and control mice (n = 2, black bars). All mice had been bred with CD-1 strain males. (B) Weekly comparison of the cumulative number of pups produced by breeding the F1 mice. Breeding between F1 males and F1 females produced by low dose-injected females (n = 2, red bars), breeding between F1 males and F1 females produced by high dose-injected females (n = 2, green bars) and breeding between F1 males and F1 females produced by PBS-injected females (n = 2, black bars). n = number of breeding pairs used.

