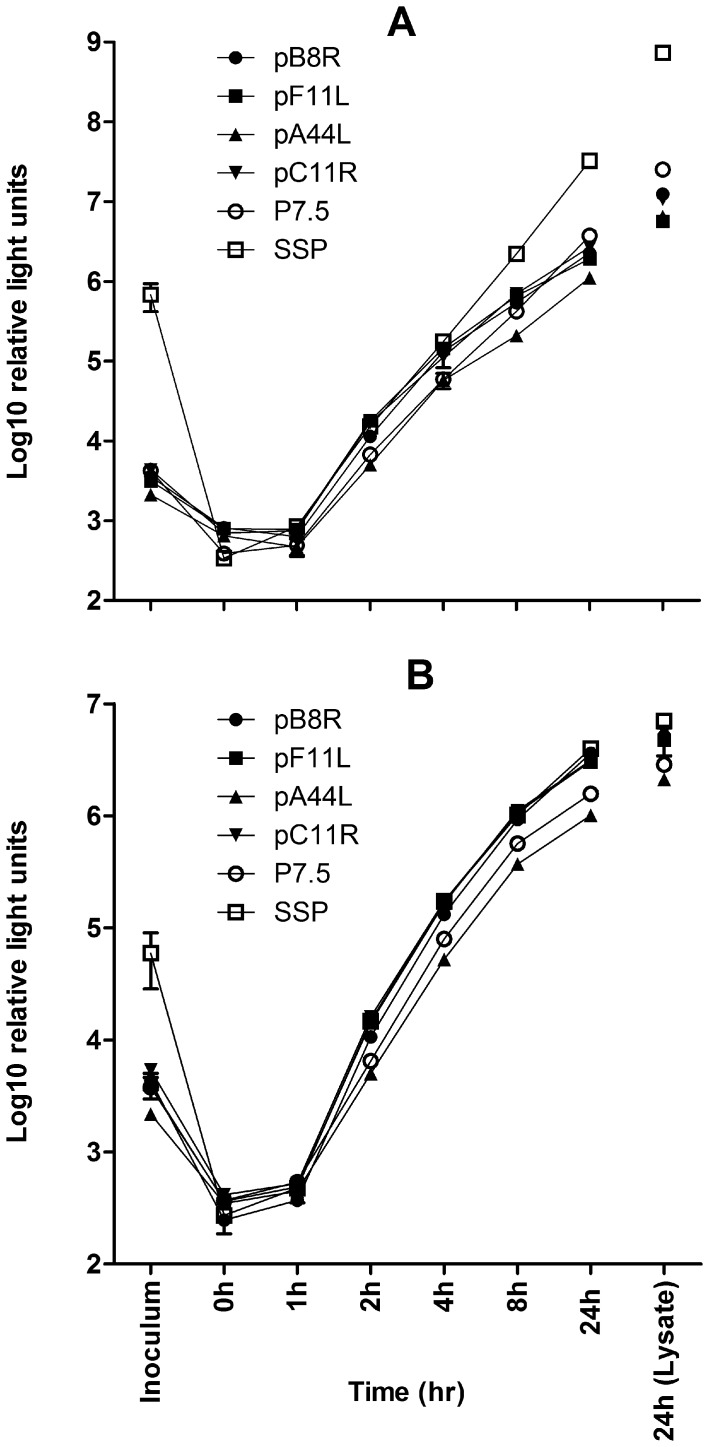
Figure 3. Timecourse of endogenous promoter activities compared to p7.5 and SSP in vitro.
BHK cells were “spinoculated” (see Materials and Methods) with 1 pfu/cell of recombinant MVA carrying tPA-Pb9-rLuc8PV under the control of the indicated promoters. Renilla luciferase activity was quantified in the inoculum, the culture supernatant at various time points post-infection, and in the cell lysate at 24 h post-infection. Cells were either untreated (A) or exposed to 40 µM AraC during and after infection (B), to inhibit post-replicative gene expression. Data shown are the mean and standard deviation of duplicates and are representative of two independent experiments.

