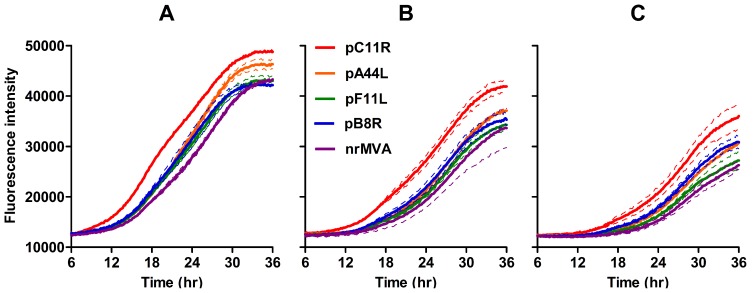
Figure 6. Growth rates of rMVA expressing tPA-Pb9-rLuc8PV under the control of endogenous MVA promoters in comparison to MVA lacking tPA-Pb9-rLuc8PV but containing the same GFP marker gene (nrMVA).
BHK cells were infected with viruses at 1 pfu/cell (A), 0.5 pfu/cell (B) or 0.25 pfu/cell (C) and fluorescence of the viral GFP marker gene was quantified every 6 minutes for 36 h using a BMG FluoSTAR equipped with 37°C and 5% CO2 incubation. Thick lines show the mean of two replicates and adjacent thin lines of the same colour represent the standard deviation. The data shown are representative of two independent experiments. Fluorescence intensity is expressed in arbitrary units.

