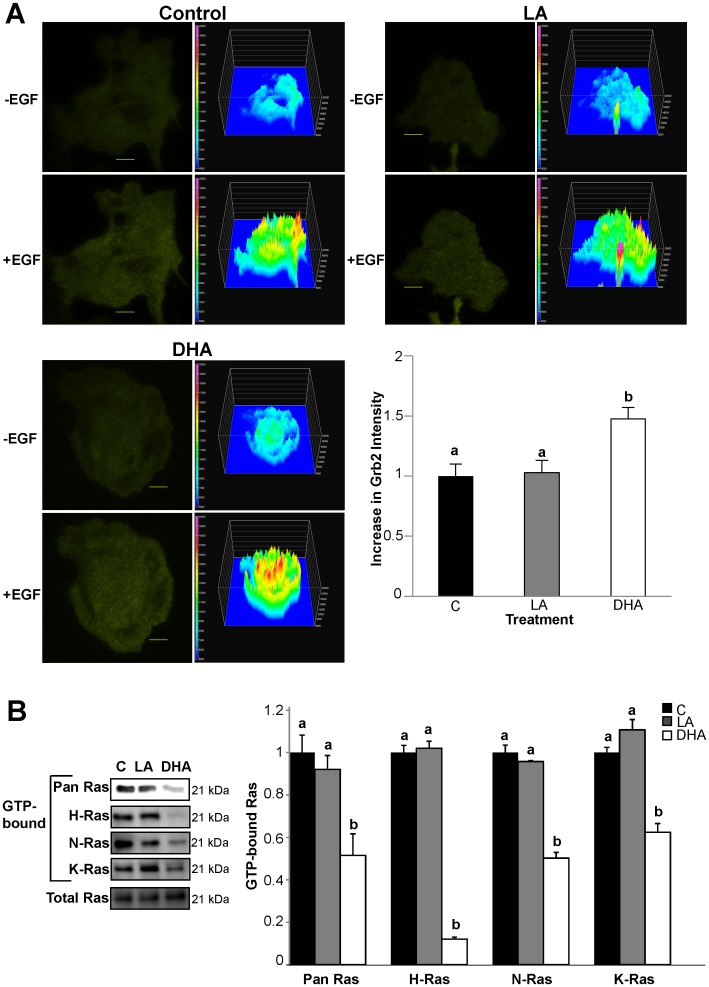
Figure 5. DHA impairs EGF-induced activation of Ras.
A) YAMC cells were treated with 50 µM BSA-complexed fatty acids for 72 h. Twenty-four h after initiating fatty acid treatment, cells were transfected with Grb2-YFP. For the final 16–18 h, cells were incubated with low serum media (0.5% FBS) with the same concentration of fatty acids and imaged using TIRF microscopy. Cells were stimulated with 100 ng/mL EGF and imaged every 5 sec. Images are representative of 4 independent experiments (n = 22−25 cells/treatment). Changes in total surface intensity were quantified using Nikon Elements AR 3.2. Fluorescence images and the respective surface intensity plots are shown. Surface intensity plots were generated in Nikon Elements AR 3.2 (the scale is from blue (lowest intensity) to red/pink (highest intensity). Data are presented as mean±SEM normalized to control. Bars, 10 µM. B) YAMC cells were treated with 50 µM BSA-complexed fatty acids for 72 h. For the final 16–18 h, cells were incubated with low serum media (0.5% FBS) with the same concentration of fatty acids. Cells were stimulated with 25 ng/mL EGF for 2 min and harvested. GTP-bound Ras was isolated using a GST pull-down assay. Isolated GTP-bound Ras was then analyzed by Western blotting for pan Ras. Isolated GTP-bound Ras was additionally analyzed by Western blotting for H, K, and N-Ras. Blots are representative of 3 independent experiments. Quantification of band volume was performed. Data are expressed as mean±SEM (n = 3), normalized to control. Statistical significance between treatments (P<0.05) as indicated by different letters was determined using ANOVA and Tukey’s test of contrast. C, control; LA, linoleic acid; DHA, docosahexaenoic acid.

