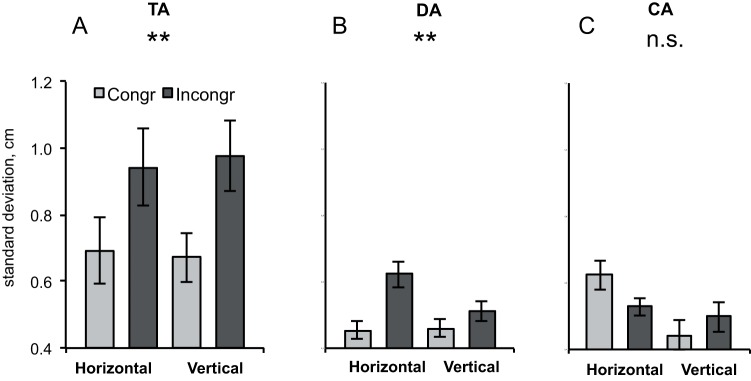
Figure 6. TA, DA and CA analyses for human agent observation.
A: Actual plane tilt of movement (mean line fit) with respect to the horizontal and vertical directions (TA). B: Standard deviation of individual line fit from the mean line fit (actual plane of movement) (DA). C: Curvature of single movements with respect to a straight line (individual line fit) (CA). Error bars represent standard error of the mean. Stars denote significance (** p<0.01).

