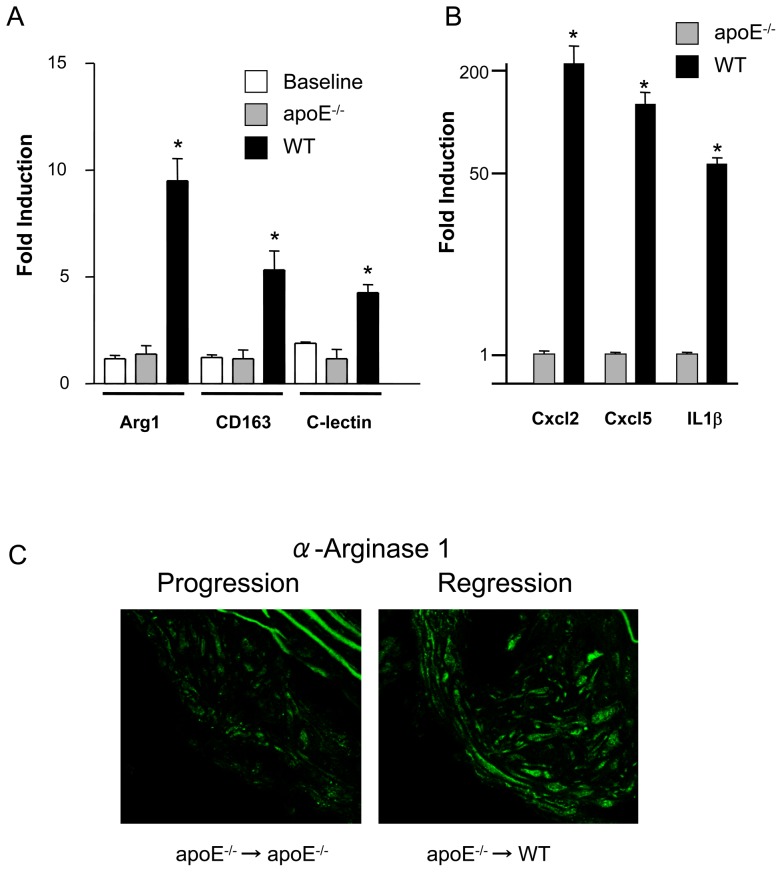
Figure 4. Regression is characterized by macrophages expressing M2 markers.
(A) qPCR analysis for RNA encoding arginase I (Arg I), CD163 and C-lectin receptor was performed on RNA extracted from CD68+ cells removed from plaques that were not transplanted (baseline), plaques transplanted into apoE−/− recipients (progression environment) and plaques transplanted into wild type recipients (WT, regression environment). The symbol * corresponds to statistical significance, p<0.05, when signal in RNA from transplanted aortas (apoE−/−, WT) was compared to signal in RNA from aortas in donor apoE−/− mice (Baseline). 9 mice were analyzed per group. Cyclophilin A was used for normalization. (B), qPCR analysis for RNA encoding Cxcl2, Cxcl5 and IL1b. The symbol * corresponds to statistical significance, p<0.05, when signal in RNA from apoE−/− was compared to signal in RNA from WT mice. 9 mice were analyzed per group. GAPDH was used for normalization. (C) Arginase I staining shows increased protein levels in regression.

