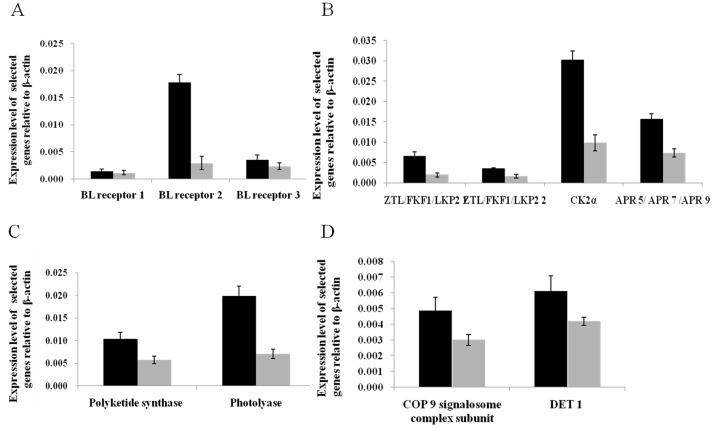
Figure 4. The expression analysis of selected genes from the RNA-seq by relative quantitative real-time PCR.
Total RNA was extracted from S. japonica exposed to BL and darkness, respectively. Real-time PCR was used to validate gene expression changes of putative BL photoreceptors (A) and in pathways of circadian rhythm (B), flavonoid biosynthesis and photoreactivation pathways (C), and photomorphogenesis (D). Increases and decreases in relative levels of transcripts with respect to the control 18 S gene are shown. For each gene, the black bar indicates the gene expression ratio of kelp exposed to BL; the grey bar indicates the expression ratio of kelp exposed to darkness. Values are mean ± standard deviation.

