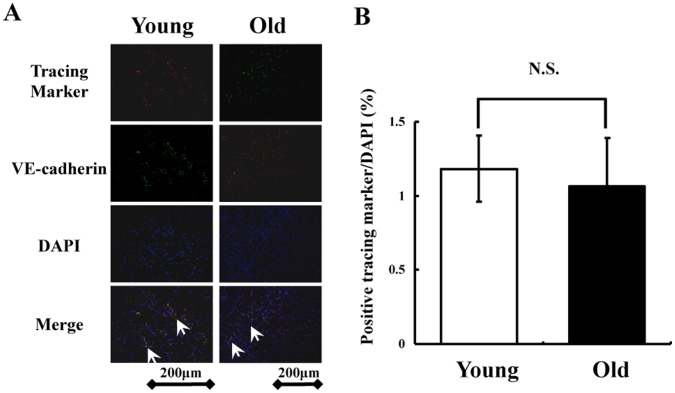
Figure 5. Tracking Flk-1+ cells during the chronic phase in vivo.
(A) PKH26 labeled Flk-1+ cells from young iPS cells (red) and EGFP labeled Flk-1+ cells from old iPS cells (green) in ischemic muscle on postoperative day 21. Double fluorescence staining of VE-cadherin and labeled Flk-1+ cells in ischemic muscle. Co-localization is indicated by yellow in the merged images (magnification, ×200; bar indicates 200 µm). Total nuclei was identified by DAPI counterstaining (blue). (B) Quantitative analysis of the number of implanted Flk-1+ cells from young and old murine iPS cells in the chronic phase (n = 4 in each group).

