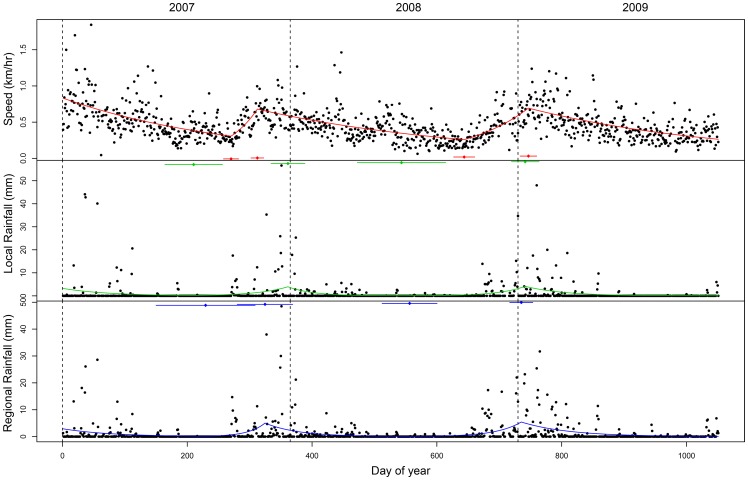
Figure 2. Multiyear piecewise regression models for Collar AM93, within the period 2007–2009, in Kruger National Park.
Variables modelled include: average speed in the upper row (red line), average local rainfall in the middle row (green line), and average regional rainfall in the lower row (blue line). The columns (separated by dashed-lines) represent different years: 2007, 2008 and 2009 from left to right. The X axis represents ‘day of year’. Breakpoints are given (in associated colours), together with the 95% confidence interval for each breakpoint (represented by horizontal bars).

