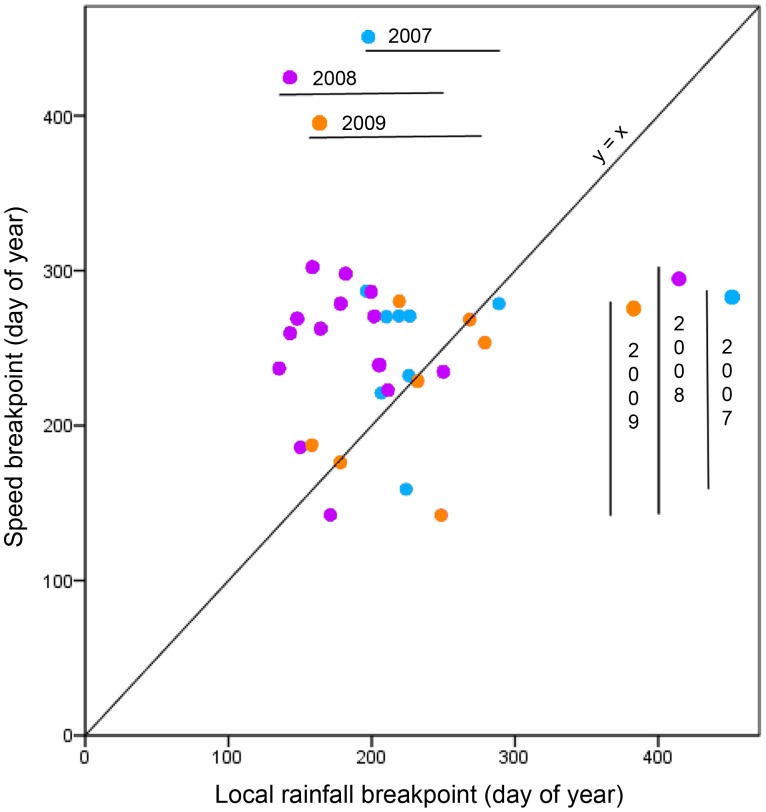
Figure 3. The effect of local rainfall on the average speed of elephant during the dry to wet season transition in Kruger National Park.
Lower speed breakpoints are plotted against lower rainfall breakpoints for 8 collars in 2007 (blue), 14 collars in 2008 (purple) and 7 collars in 2009 (orange). Points above the line (y = x) represent speed breakpoints that occur after rainfall breakpoints; points below the line (y = x) represent speed breakpoints that occur before rainfall breakpoints. Rainfall and speed breakpoints that fall exactly on the line are equal to each other i.e. the breakpoints occur simultaneously. Vertical lines for each year represent the range in speed breakpoints (from Day 159 to 287 in 2007; Day 142 to 302 in 2008 and Day 142 to 280 in 2009). Horizontal lines represent the range in local rainfall (from Day 196 to 289 in 2007; Day 135 to 250 in 2008 and Day 158 to 279 in 2009).

