
Fig. 4.
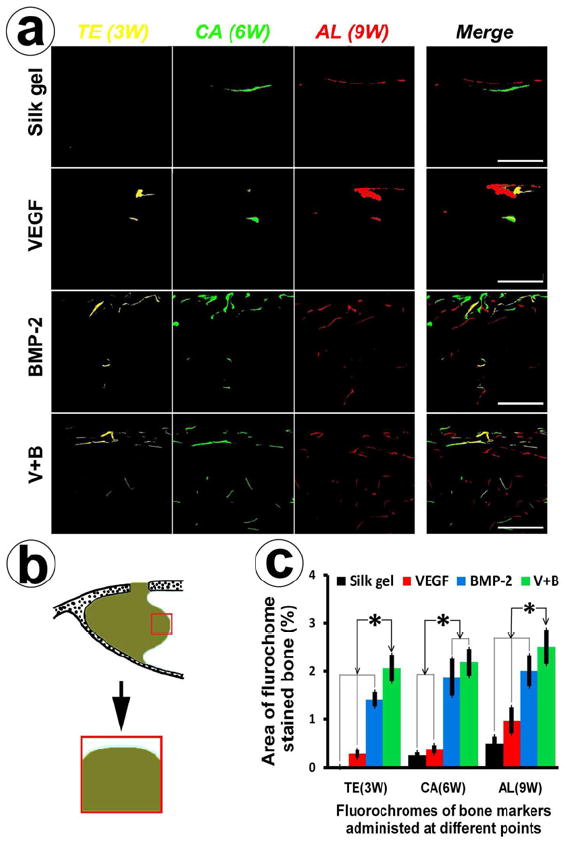
Sequential fluorescent labeling and histomophometric analysis. (a) Polychrome fluorescent labeling of TE, CA and AL was administrated at 3, 6, 9 weeks post-operation. Images of column “Merge 1” represent the merged three fluorochromes. “Merge 2” column represents merged images of the three fluorochromes together with the plain confocal laser microscope image (bar = 500 μm). (b) This scheme indicates the selected region used for quantifying the area of fluorochrome labeling (red color rectangle labeled region). (c) This graph represents the percentage of the labeled area of the three fluochromes of the four groups at different periods (* indicates significant differences, p < 0.05).