
Fig. 5.
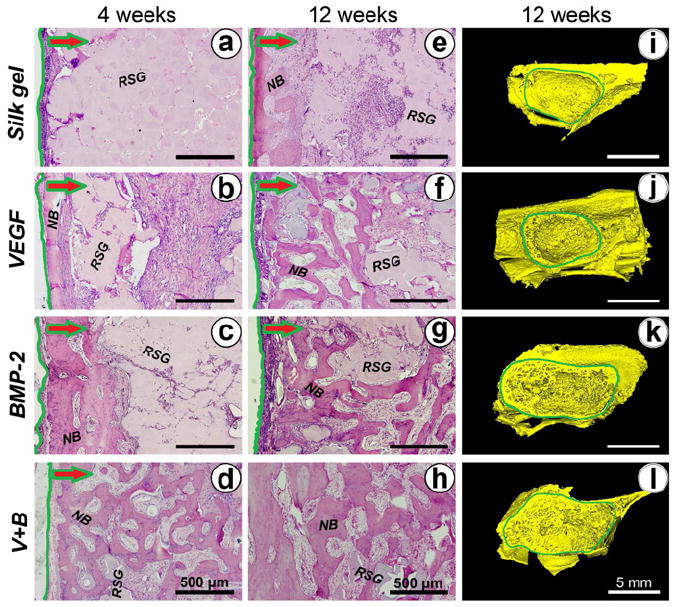
New bone formation detected by hematoxylin and eosin staining and Micro-CT. (a-d) and (e-h) shows local histological images of the different groups at 4 and 12 weeks post-operation, respectively. Green lines label the boundary of the augmented sinus region. The arrows indicate the direction of newly formed tissue ingrowth into the silk gel from the boundary. (NB: new bone; RSG: remnant silk gel). (i-l) Three dimensional reconstructed images of augmented sinus were taken 12 weeks after operation.