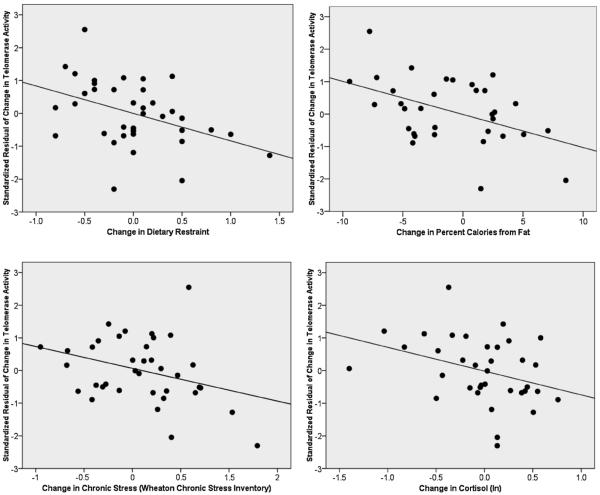
Figure 2.
Scatter plots of associations between standardized residuals of changes in telomerase activity, natural log transformed (partialing out baseline telomerase activity) with changes in dietary restraint (upper left); changes in percent calories from fat (upper right); changes in chronic stress (bottom left); and changes in cortisol (bottom right). See Table 3 for statistical approach and significance.

