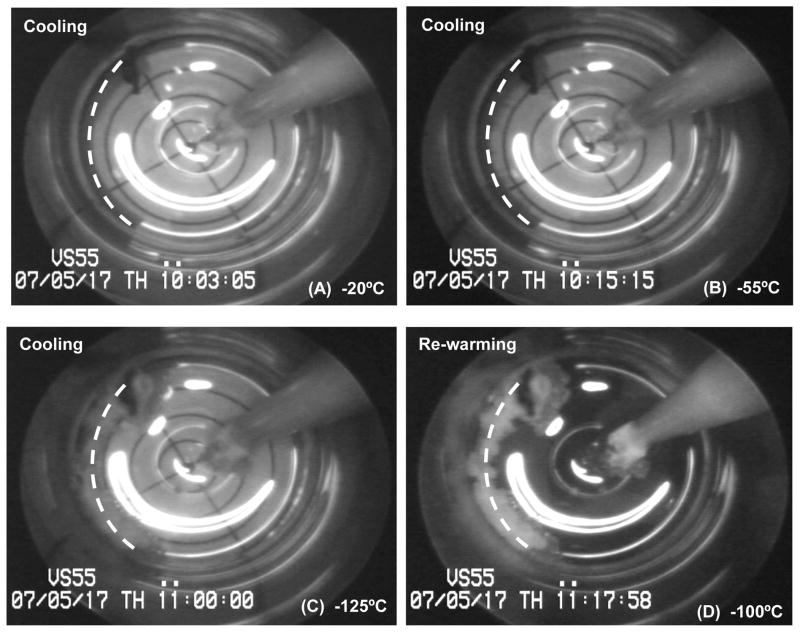
Figure 4.
Cryomacrographs of ice formation during slow cooling vitrification of a vessel segment. The vessel centerline is represented by a dashed white line. Following vitrification, low contractility was observed in the presence of both NP and PP, while a fresh comparable metabolic activity was measured. Nucleation and ice-crystallization around the vessel started below −50°C, Panel (B). Ice crystallization was initiated around the temperature probe at −80°C, yet it remained confined to probe vicinity, Panel (C). Panel (D) image was taken at −100°C during rewarming, right at the moment of sleeve replacement. No fractures were visible in this experiment.

