
Figure 3.
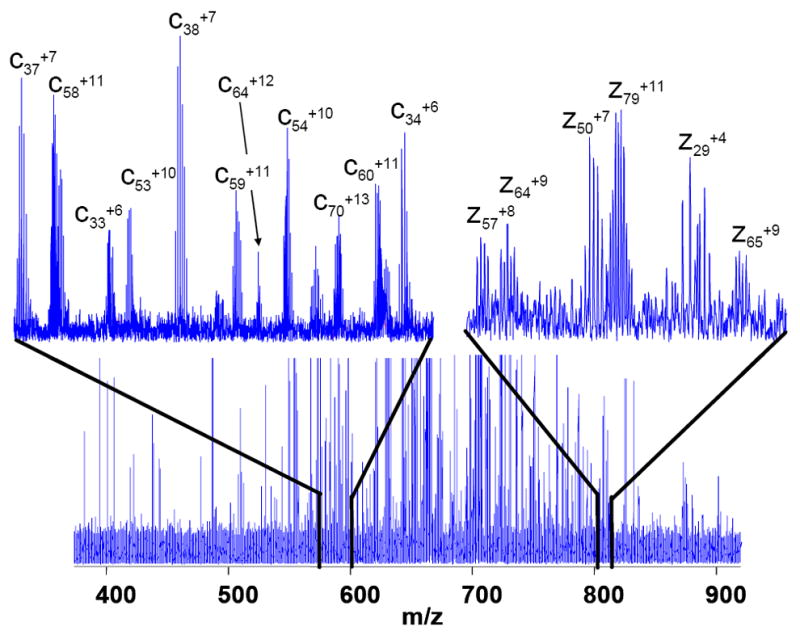
Region of an ECD spectrum of SWIFT isolated ions from bovine histone H4 charge state 18+. Over 90% of signals whose signal to noise ratio greater than 3 can be assigned as c or z ions of protein sequence with predicted modifications. Upper left trace: a portion of spectrum m/z 573-600 shows pure c-ions. Upper right trace: a section of spectrum (m/z 803-813) shows only z-ions.