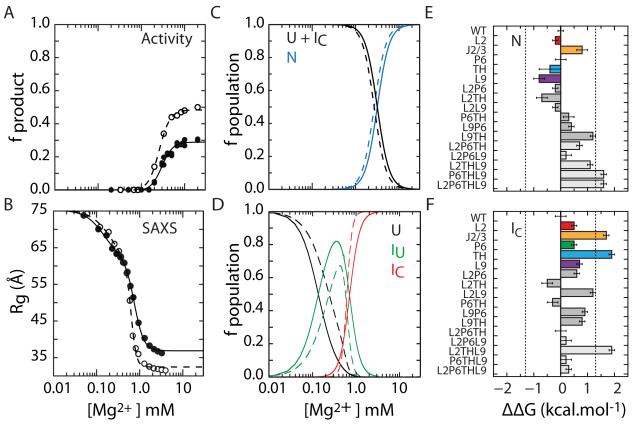
Figure 3. Mutations perturb folding free energies of IC and N.
(A) Single-turnover activity assay (fproduct) of IC to N folding transition (eq. 1). The maximum product is 50% due to slow product release and religation (Tanner and Cech, 1996). (B) SAXS measurement of U to IC folding transition under the conditions in (A). The change in R 2g was fit to a three-state model (eq. 2). Filled symbols, L9P6 mutant; open symbols, WT. (C,D) Populations calculated from data in A and B, respectively. U, unfolded state; IC, compact intermediate; N, native state; IU, extended non-native intermediate. (E,F) Differences in folding free energies ΔΔG = ΔGmut – ΔG evaluated at 5 mM MgCl2 (N) and 0.8 mM MgCl2 (IC). These Mg2+ concentrations (Cref) corresponded to 90% saturation of the respective WT folding transitions. Error bars depict standard deviations calculated from 10,000 resamplings of fit residuals. Dashed lines at ±1.3 kcal mol−1 indicate the magnitude of WT ΔG. See Figure S3 and Table S2 for details.

