
Fig. 3.
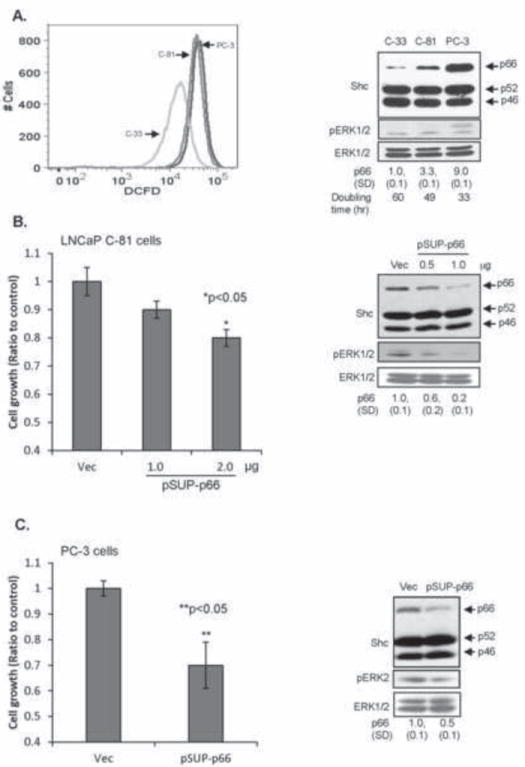
Effect of p66Shc expression on PCa cell growth and ROS production. (A) LNCaP C-33, C-81 and PC-3 cells were labeled with 10 μM DCF-DA for 30 min. The labeled cells were subjected to flow cytometric analysis for quantitative estimation of ROS production (left panel). Cell lysates were analyzed for p66Shc protein and ERK1/2 phosphorylation (right panel). The data shown is a representative of four sets of independent experiments. (B) Cell growth and western blot analyses of p66Shc knock-down LNCaP C-81 cells. LNCaP C-81 cells were plated at a density of 1×10⁵ cells/well of six-well plates in duplicates for 48 h. The cells were transiently transfected with shRNA to p66Shc (pSUP-p66). Control cells were transfected with pSUPER vector alone (Vec). 3 days after transfection, cells were harvested and counted (left panel). Cell lysates from other set of cells transfected with different amounts of pSUP-p66 were analyzed for p66Shc protein and ERK1/2 phosphorylation (right panel). (C) As described in (B), PC-3 cells were transfected with pSUP-p66. Cell growth, p66Shc protein and ERK2 phosphorylation were analyzed 3 days post-transfection. The data shown is the average of two sets of independent experiments.