Fig. 4.
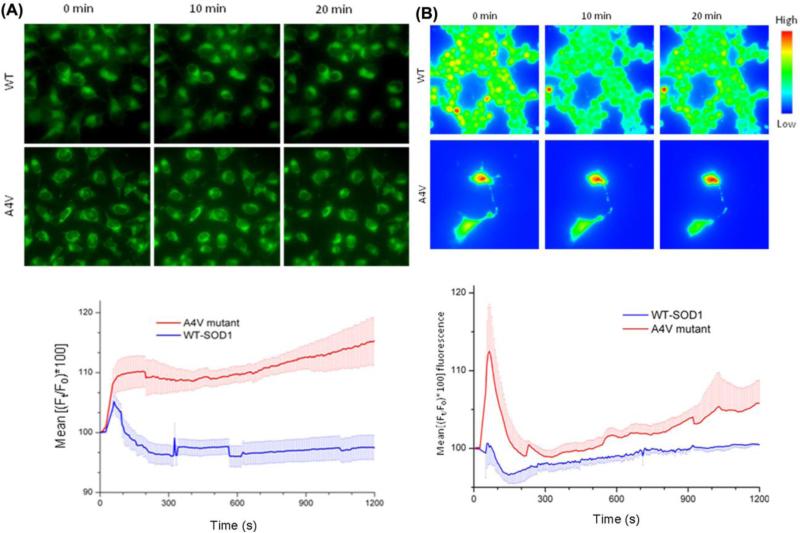
A4V mutant causes membrane depolarization and an increase in intracellular calcium in N2A cells. A. Membrane potential specific fluorescence was recorded with DiBAC4(3) dye. Relative change in mean fluorescence [(Ft/F0)*100] intensity at a given time ‘t’, (Ft) with respect to basal fluorescence (F0) is expressed as a percentage. A4V mutant causes significant membrane depolarization at 10 min (p< 0.0001, n=8 experiments), at 20 min (P<0.002, n=7 experiments) compared to its wildtype (WT) counterpart. The error bars denote standard error (S.E.) of the mean fluorescence. B. Calcium specific fluorescence (Fluo-4) assay following treatment with 1 μM WT and A4V mutant. Mean values of all experiments plotted with S.E. of mean (n=4 for WT and n=6 for A4V). Significant calcium flux was only observed after 15 min (p<0.03) between the two groups.

