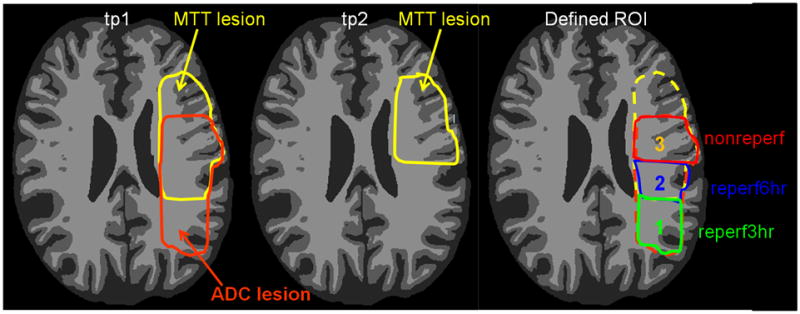
Fig 1.

A schematic representation of the definition of three ROIs within tp1 abnormal ADC regions. Yellow color outlines MTT lesion at tp1 and tp2, and orange color outlines ADC lesion at tp1. Region 1 represents ROI(1)reperf3hr that exhibits abnormal ADC at tp1but normal MTT at tp1 and tp2; Region 2 represents ROI(2)reperf6hr that has abnormal ADC and MTT at tp1 and normal MTT at tp2; and region 3 represents ROI(3)nonreperf that shows abnormal ADC at tp1 and abnormal MTT at tp1 and tp2.
