Figure 5.
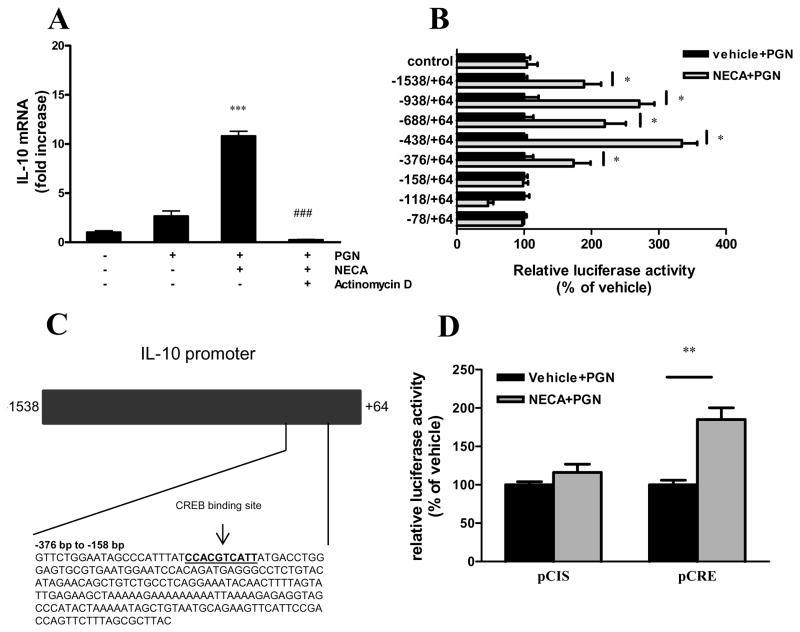
A2BAR activation augments IL-10 transcription. A. BV-2 cells were treated with 5 μg/ml actinomycin D or its vehicle 2 hours prior to treatment with 10 μM NECA and 20 μg/ml PGN. After 6 hours of incubation, RNA was isolated from the cells, and was reverse transcribed to cDNA. Real-time PCR was performed using the cDNA samples using IL-10 and 18S specific primers. Results were normalized to 18S mRNA content and shown as fold increase relative to untreated samples. ***p<0.001 vs. PGN, ###p<0.001 vs. NECA+PGN. B. BV-2 cells transfected with IL-10 promoter-luciferase constructs and control plasmid were treated with 10 μM NECA and 20 μg/ml PGN for 8 hours. Luciferase activity was determined from whole cell extracts and was normalized to protein content. Data are shown as percent of vehicle (treated only with PGN). *p<0.05 vs. vehicle. C. The figure represents the IL-10 promoter region. The numbers show the positions relative to the transcription start site. The highlighted area shows the nucleotide sequence of the region between −376 and −158, which harbors a binding site for CREB. D. BV-2 cells transfected with pCRE-luciferase construct and control plasmid (pCIS) were treated with 10 μM NECA and 20 μg/ml PGN for 8 hours. Luciferase activity was determined from whole cell extracts and was normalized to protein content. Data shown are percent of vehicle (groups treated only with PGN). **p<0.01 vs. vehicle. Results (mean ± SEM) shown are representative of three separate experiments (n=4 in each).

