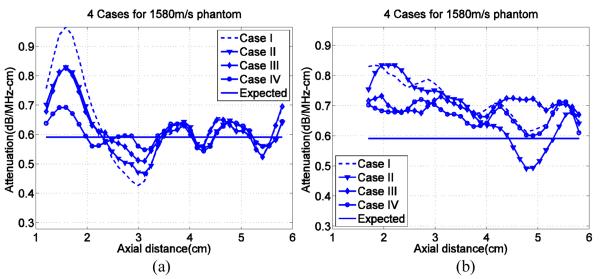
FIG. 2.
Slopes of attenuation coefficient vs. frequency over the ROI with a 2cm transmit focal distance, for all four experimental cases (Cases I, II, III, IV) shown on each graph. Subplot (a) is from simulated data while subplot (b) shows results from experiments. The sound speed in the sample is 1580m/s and that in the reference phantom is 1540m/s. The model attenuation coefficients in the sample and reference phantom are 0.591dB/cm-MHz and 0.573dB/cm-MHz respectively (horizontal line).

