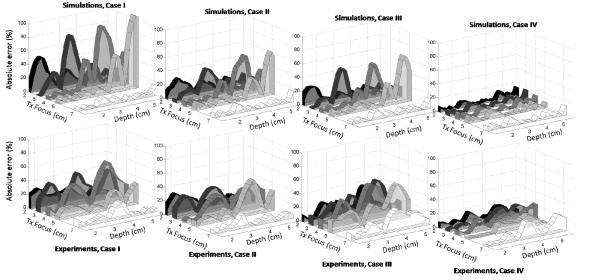
FIG. 3.
Absolute percent error of slopes of attenuation coefficient vs. frequency from Cases I, II, III, and IV ( from left to right), derived from simulation (top row) and experimental (bottom row) data, where csam = 1500m/s and cref = 1540m/s: Case I, where no corrections are applied, i.e. cbf = 1540m/s for both sample and reference and zsam ≠ zref ; Case II, where cbf = 1540m/s for both sample and reference but zsam = zref; Case III, where cbf matches each of csam and cref but no depth correction is applied, zsam ≠ zref ; Case IV, where cbf matches each of csam and cref AND sound speed corrections are used to match distances, zsam = zref. The transmit focus settings were 2cm, 3cm, 4cm, 5cm, and 7cm. The model attenuation coefficients in the sample and reference phantom are 0.559dB/cm-MHz and 0.573dB/cm-MHz, respectively.

