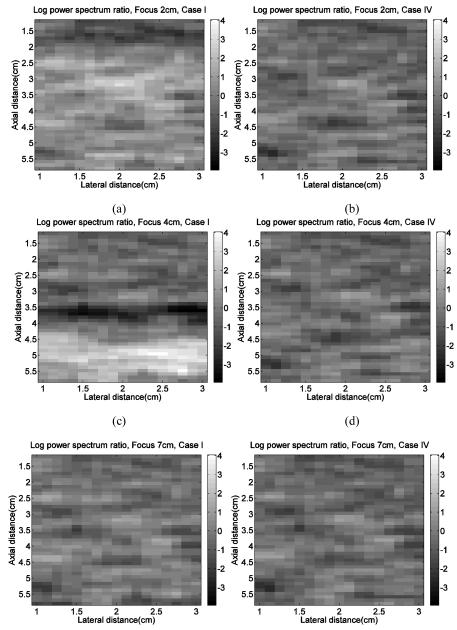
FIG.5.

Images from simulations depicting ratios of integrated echo signal power spectra from a sample to that from corresponding locations in a reference phantom. The sample and reference phantom have identical attenuation and backscatter coefficients, but csam = 1500m/s and cref = 1540m/s. The ratio values are expressed in dB. (a) Case I with transmit focus at 2cm (b) Case IV with transmit focus at 2cm (c) Case I with transmit focus at 4cm (d) Case IV with transmit focus at 4cm (e) Case I with transmit focus at 7cm (f) Case IV with transmit focus at 7cm.

