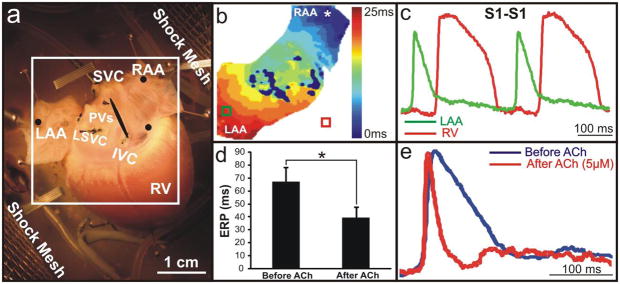
Figure 1. Experimental Setup.
(a) Photograph of a typical preparation with shock meshes labeled, located 10 cm apart. The black circles represent the locations of pacing/sensing electrodes. (b,c) Typical activation map and optical action potentials (OAPs) during pacing of the RAA (300 ms). (The deep blue areas in the center represent pixels that have been excluded from analysis due to noise from sutures and connective tissue.) (d) Average ERP before and after ACh. (e) Representative OAPs from the RAA before and after the addition of 5 μM ACh reflecting a 57% decrease in the action potential duration.

