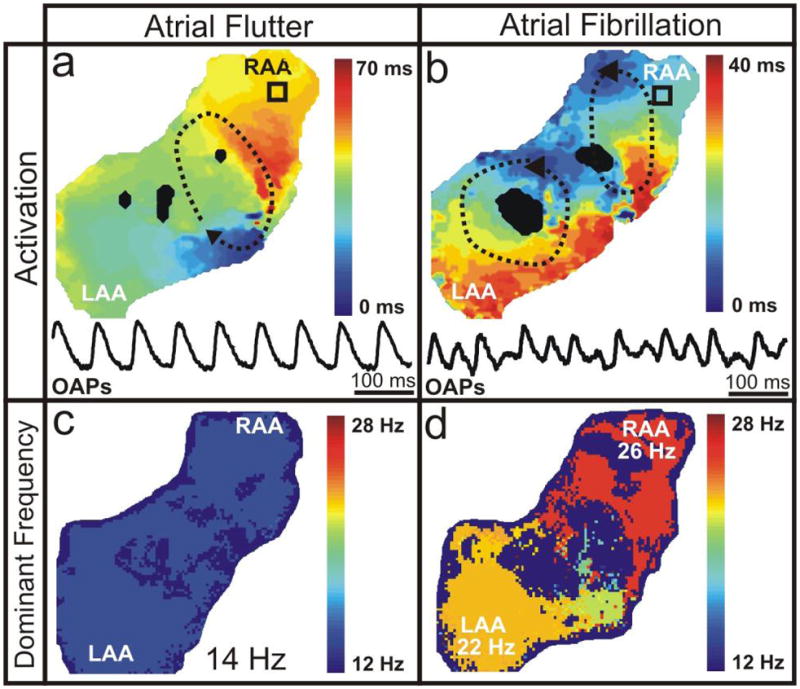
Figure 2. Typical Atrial Flutter and Fibrillation.

(a,b) Typical activation maps, representative of one arrhythmia cycle, and OAPs (as indicated by the black squares) of AFl and AF, respectively. Dashed black lines with arrows show the location and direction of the reentrant circuits. (c,d) Frequency distribution for typical examples of AFl and AF, respectively.
