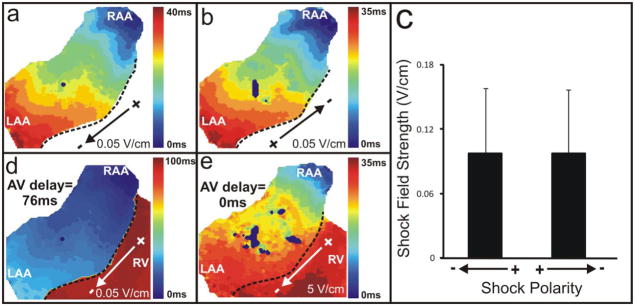
Figure 4. Far Field Excitation.
(a,b) Activation maps resulting from opposite polarity shocks at a field strength of ±0.05 V/cm. The dotted black line demarcates the AV groove. (c) Average shock field strength of both polarities (0.097±0.06 V/cm). (d) Activation of the ventricles at a physiological AV delay (76 ms) due to far field excitation of the atria with a shock field strength of 0.05 V/cm. (e) Simultaneous activation of the atria and ventricles with a higher voltage shock (5 V/cm).

