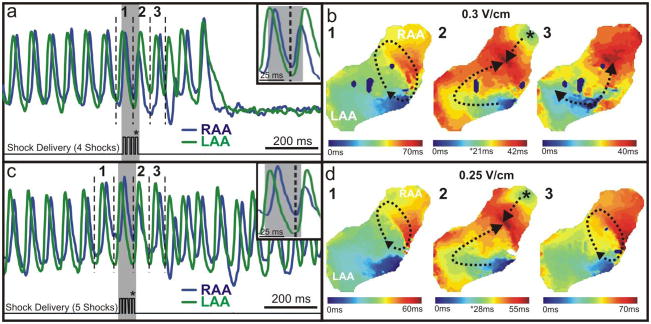
Figure 7. Application of Multiple Shocks to AFl.
(a) In this example of successful arrhythmia termination, four 10 ms shocks (0.3 V/cm) were applied during one CL of AFl (70 ms). OAPs are shown from the RAA and LAA before and after termination. (b) Activation maps reconstructed from the dV/dtmax of the OAPs denoted by 1–3 in panel (a). (c) In this example of unsuccessful arrhythmia termination, five 10 ms shocks (0.25 V/cm) were applied during one CL of the same arrhythmia. (d) Activation maps reconstructed from the OAPs denoted 1–3 in panel (c). The asterisks in panels (b,d) represent the shocks indicated in panels (a,c).

