
Figure 2.
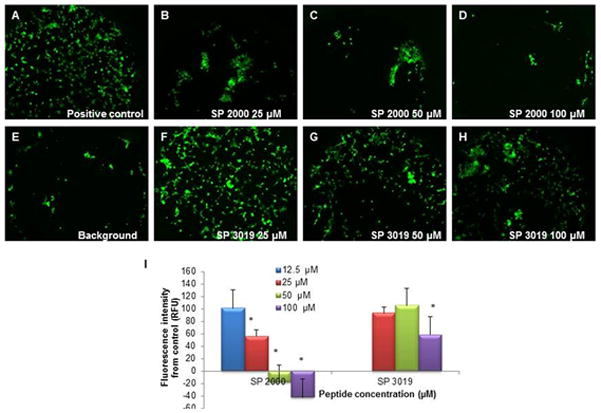
Migration activity. The inhibitory activity of the peptides on the migration of the glioma cells U87. Panel (A) illustrates the positive control (untreated cells); panels (B) through (D) depict the inhibition activity of the SP2000 at several concentrations, Panel (E) illustrates a typical background measurement (image of the well with the stopper removed immediately preceding the imaging) and panels (F) through (H) demonstrate the inhibitory activity of SP3019 peptide. Panel (I) illustrates the quantification of the images. The negative values are due to the subtraction of the background values which can vary significantly between the wells depending on the alignment of the stopper in the well. Error bars depict STD. * indicates statistical significance (p < 0.05) from the control.