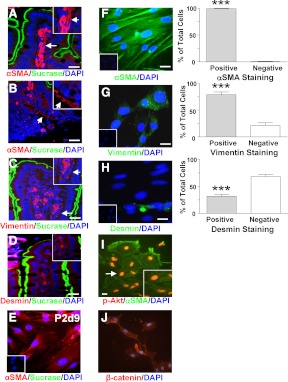
Fig. 1.
Murine ISEMF cells show enrichment of cells with a SEMF phenotype. A–D, Representative double-immunohistochemical staining of mouse jejunum for αSMA (A and B), vimentin (C), or desmin (D) (red) with sucrase-isomaltase (green). Nuclei were identified by DAPI staining (blue). Arrows indicate potential ISEMF cells in the main panels and the magnified insets. Photomicrographs were taken with identical microscope settings. Scale bar, 20 μm. E, Double-immunocytochemical staining of ISEMF cells on d 9 of P2 for αSMA (red) and sucrase-isomaltase (green). Nuclei were identified by DAPI staining (blue). Inset shows the negative control. Scale bar, 20 μm. F–H, Representative immunocytochemical pictures of ISEMF stained for αSMA (F), vimentin (G), or desmin (H) (green). Nuclei were identified by DAPI staining (blue). Insets show negative controls. Scale bar, 20 μm. The percentage of cells that were positively and negatively stained for each marker was determined from more than 100 cells from L1 and L2, at P5, P7, and P11, counted to make each n = 1, for a total of n = 3–4; ***, P < 0.001 vs. negative cells. I, Representative immunocytochemical picture of ISEMF cells stained for αSMA (green) and pAkt (red). Nuclei were identified by DAPI staining (blue) (data not shown). Inset shows magnification of cell indicated by arrow. Greater than 100 cells from L5, at P10, P13, and P15, was counted to make n = 1, for a total of n = 4. J, Representative immunocytochemical staining of ISEMF cells for β-catenin (red). Nuclei were identified by DAPI staining (blue).

