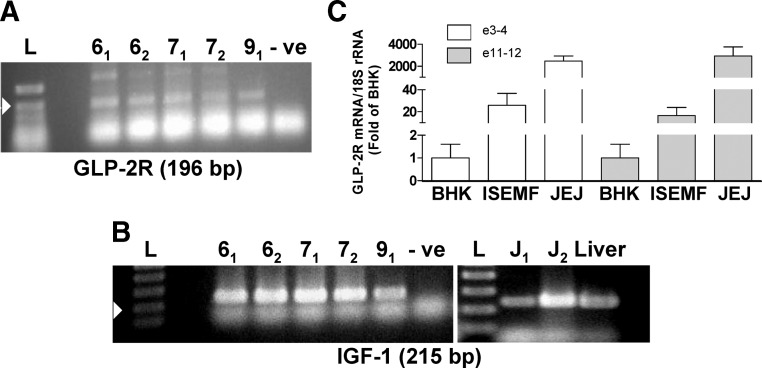
Fig. 2.
Murine ISEMF cells express GLP-2R and IGF-I mRNA transcripts. A and B, RT-PCR for GLP-2R (A) and IGF-I (B) mRNA transcripts in ISEMF cells from L2 and L3, at P6, P7, and P9. The subscript indicates two independent samples. The arrowhead indicates the 200-bp marker on the molecular weight ladder (L); -ve indicates the water control. Mouse jejunum (J) and liver were used as positive controls for the IGF-I mRNA transcript. C, GLP-2R mRNA transcript levels were determined by real-time RT-PCR in BHK cells (negative control), ISEMF cells, and normal mouse jejunum (positive control). Expression was normalized to 18S rRNA levels (n = 4–6; L5 and L6, at P5–P7 and P9).

