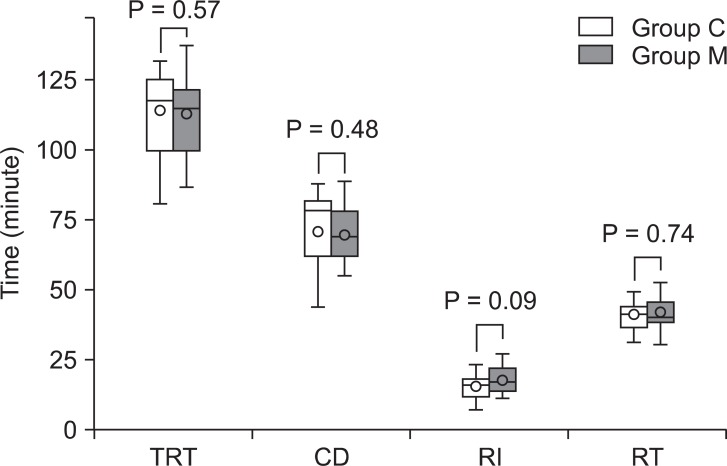
Fig. 2.
Recovery characteristics. There were no significant differences between groups in all recovery findings. Total recovery time (TRT) is the time from the start of cisatracurium injection until TOF ratio = 0.9. Clinical duration (CD) is the time in minutes from the start of cisatracurium injection until T1 of the TOF had recovered to 25% of the final T1 value. Recovery index (RI) is the time in minutes between 25% and 75% recovery of the final T1 value. Recovery time (RT) is the time in minutes between 25% recovery of the final T1 value and a TOF ratio of 0.9. In the MgSO4 group (group M), patients received MgSO4 30 mg/kg in 0.9% normal saline (total volume = 100 ml) intravenously. In the control group (group C), patients received the same volume of 0.9% normal saline alone. White symbol, magnesium; Grey symbol with polka dots, control. The box-and-whisker plots show 10th and 90th percentiles, lower and upper quartiles, medians (horizontal bars) and means (circles).

