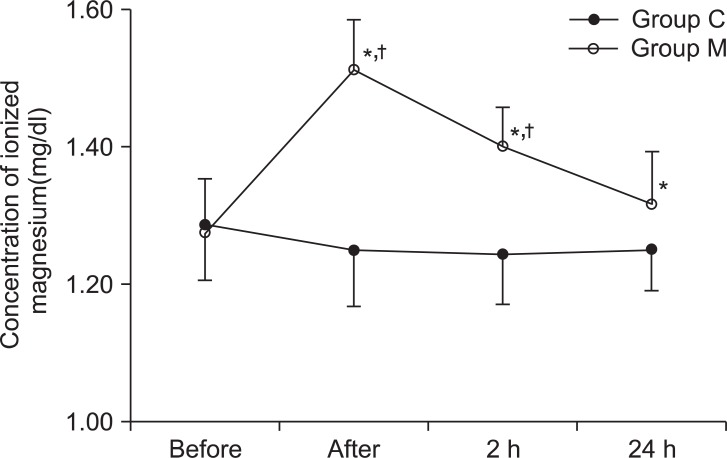
Fig. 4.
The concentration of ionized magnesium. There were significant increases of the concentration of ionized magnesium in group M at all time points. In the MgSO4 group (group M), patients received MgSO4 30 mg/kg in 0.9% normal saline (total volume = 100 ml) intravenously. In the control group (group C), patients received the same volume of 0.9% normal saline alone. Before: before administration of study agents. After: immediately administration of study agents. 2 h and 24 h: the time at 2 h after operation start and postoperative 24h. *P < 0.05 is compared with Group C. †P < 0.01 is compared before injection of study agents within each groups.

