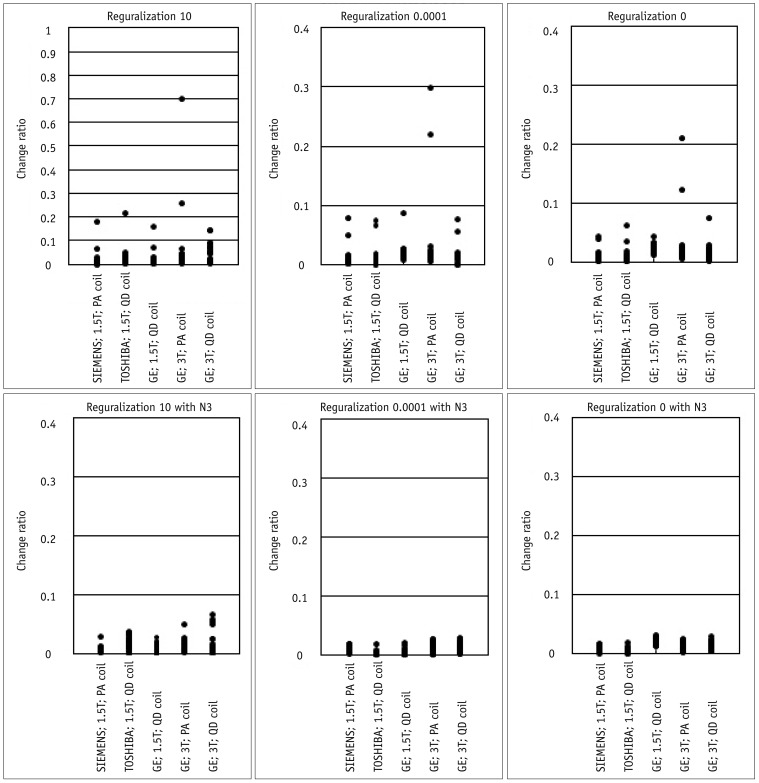
Fig. 2.
Change ratio of structural volume of temporal lobe for each system. Bias-correction levels are shown at top of figure. Change ratios showed decrease with increasing bias-correction power (i.e., Regularization 10 < 0.0001 < 0 < 0 with N3); this trend was strongest for GE 3T PA coil protocol. 3T = 3 tesla, PA = phased-array, QD = quadrature

