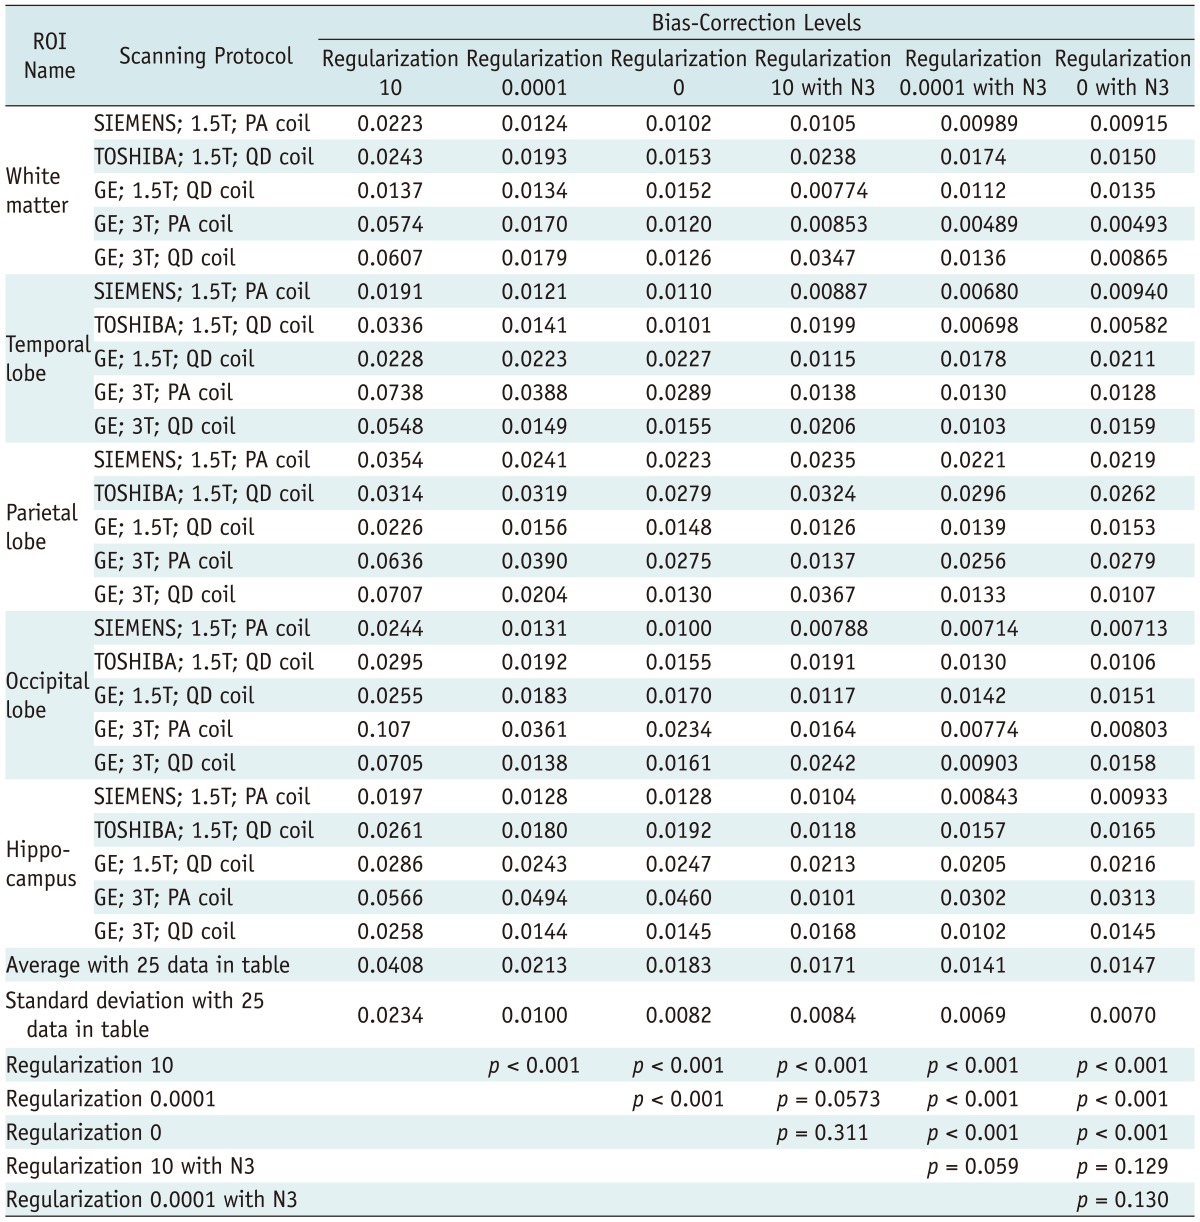
Table 1.
Average Change Ratios (%) Are Summarized in Upper Table. Region-of-Interest Names and Scanning Protocols Are Shown at Left Side of Table. Bias-Correction Levels Are Shown at Top of Table. Significant Statistical Differences (Paired Student's t Test) between Bias-Correction Revels Are Summarized in Lower Table
Note.- 3T = 3 tesla, PA = phased-array, QD = quadrature

