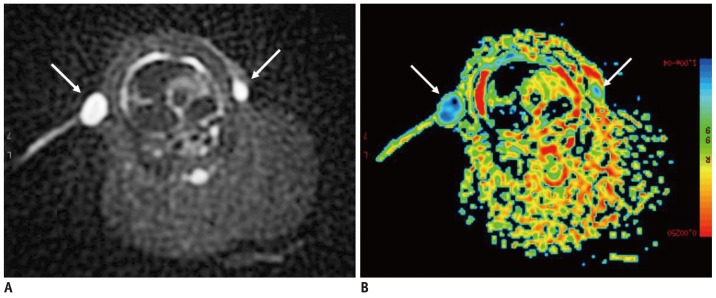
Fig. 3.
Manifestation of diffusion-weighted imaging and apparent diffusion coefficient map of axillary metastatic lymph nodes.
Two axillary metastatic lymph nodes in bilateral axillary fossa on axial diffusion-weighted imaging show obviously homogeneous high signal intensity with clear margin (arrow) (A). Both of them demonstrated as areas of blue on corresponding apparent diffusion coefficient map (arrow), and relative apparent diffusion coefficient value of left and right nodes is 0.60, 0.55, respectively (B).

