
Figure 2.
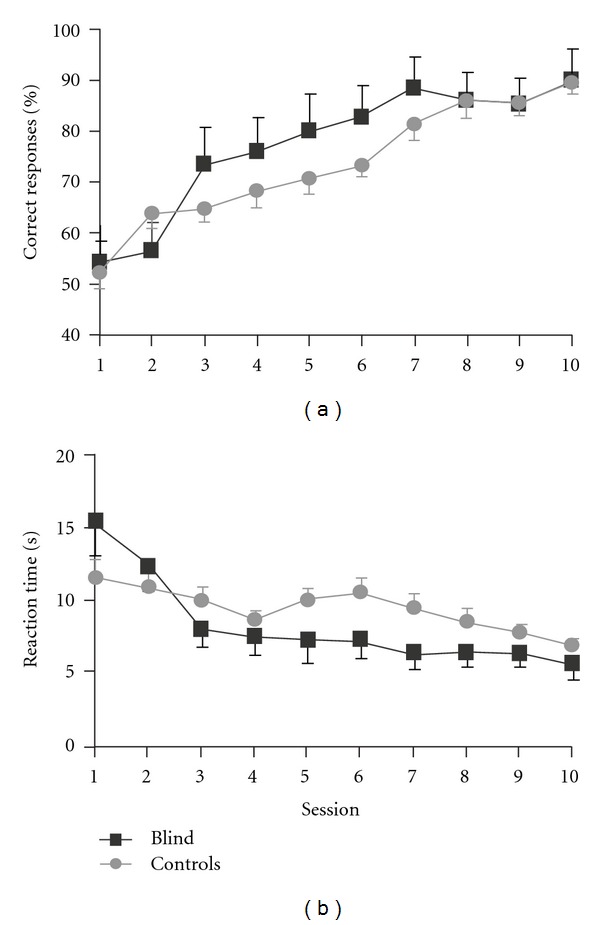
Learning curves for shape recognition in congenitally blind and blindfolded control subjects. (a) Mean percentage changes ± SEM of correct responses and (b) mean reaction times ± SEM. No significant differences in performance were observed between the groups.