
Figure 3.
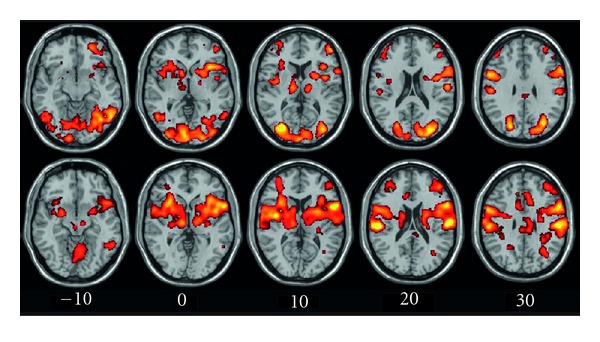
Axial maps showing brain activations for the contrast “shapes-rest” in congenitally blind (upper row) and blindfolded control (lower row) subjects. The color-coded t-maps illustrate voxels showing a task-related increase in activation at P < 0.01, FDR-corrected. Right side of the brain is to the right of the image.