
Figure 4.
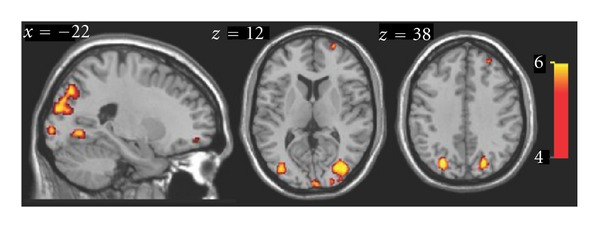
Cortical maps showing brain areas where activity was significantly larger in congenitally blind compared to blindfolded control subjects. The color-coded t-map shows the voxels with a relative increase in task-related activation in the blind group relative to controls at P < 0.01, FDR-corrected. Right side of the brain is to the right of the image.