Figure 1.

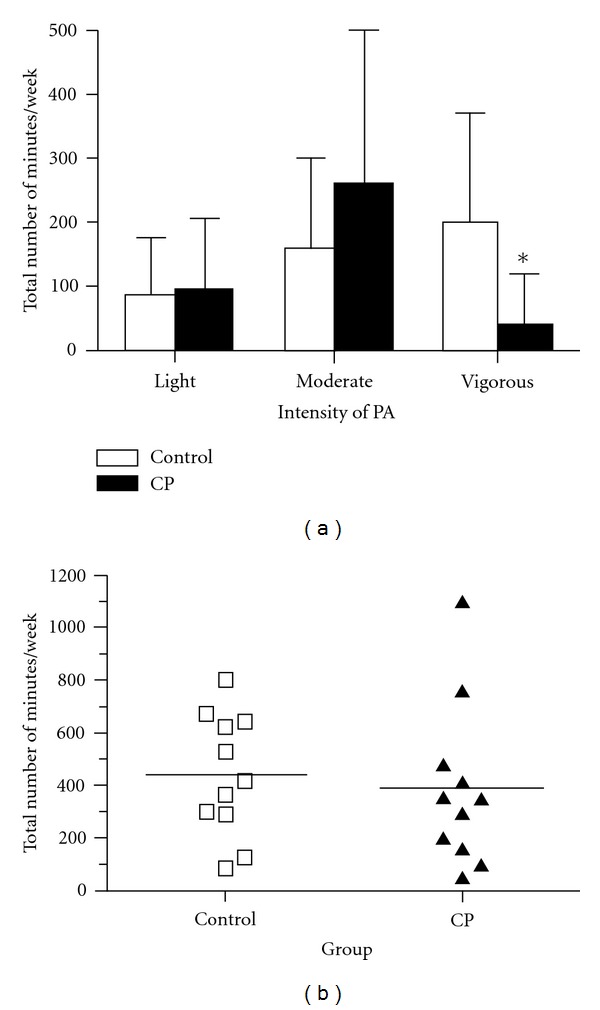
(a) Group comparisons of weekly PA according to intensity. (b) Group comparisons of total PA (summation of all three intensities) performed in one week, individual data and group means presented; n = 11 in each group.

(a) Group comparisons of weekly PA according to intensity. (b) Group comparisons of total PA (summation of all three intensities) performed in one week, individual data and group means presented; n = 11 in each group.