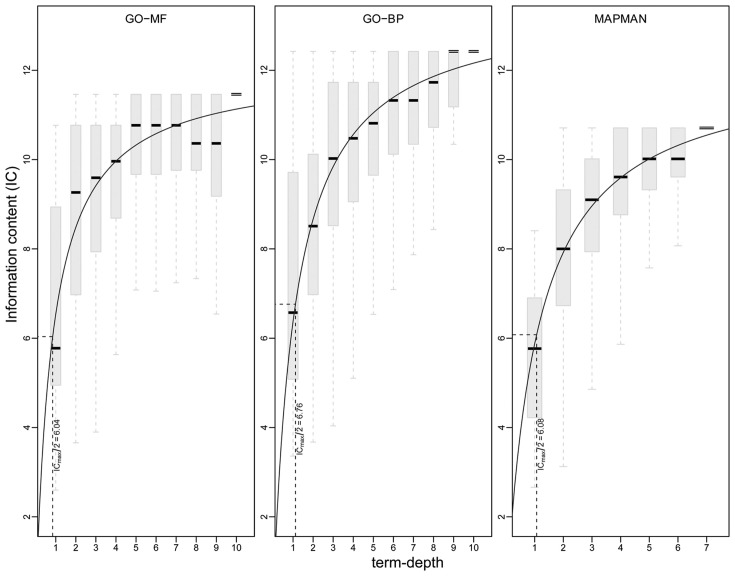
Figure 7.
Visualization of information content (y-axis) at a given term depth (x-axis) for GO-MF (left), GO-BP (middle), and MapMan (right). A non-linear regression is used on the medians of the information content per concept depth following Michaelis-Menten kinetics (solid line). The constant Vmax/2 is shown by dotted lines (see main text for details).

