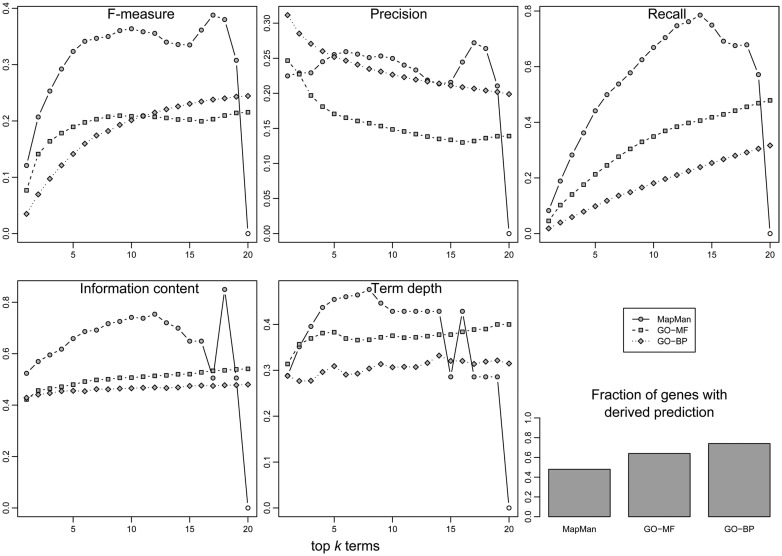
Figure 8.
Evaluation of prediction performance (y-axis) for gene function annotation using the three ontologies. Three classical performance indices from information retrieval were employed: F-measure (upper-left), precision (upper-middle), and recall (upper-right). In addition, the information content (lower-right), and the concept depth relative to the maximum depth within the respective ontology (lower-middle) of predicted concepts were evaluated. In all cases, the 20 most abundant concepts (x-axis) in an unknown gene’s neighborhood are evaluated. Finally, the fraction of unknown genes for which a prediction could be derived is given (bar plot, lower-right).

