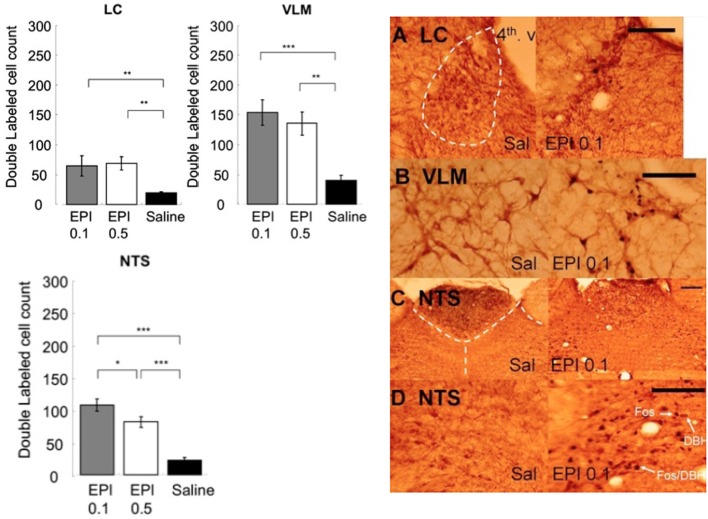
Figure 8.
Systemic injection of epinephrine activated noradrenergic cells in the LC, VLM, and NTS. (*, **, and *** denotes significant difference between the compared groups with a p-value less than 0.05, 0.01, and 0.001, respectively). Photomicrographs of Fos/DBH labeling in the LC (A), VLM (B), NTS (C,D) following saline or epinephrine injection (0.1 mg/kg). Scale bar = 200 um. (4th v.: the fourth ventricle).

