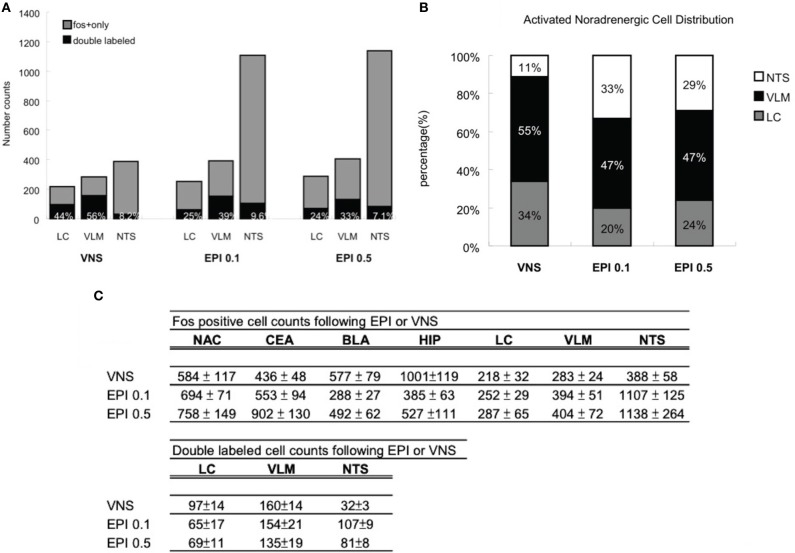
Figure 9.
(A) Percentage of noradrenergic of cell activation. Vagus nerve stimulation induces noradrenergic activation that accounts for 44% of the neuronal activity in the LC, 56% in the VLM, and 8.2% in the NTS. In addition, 0.1 mg/kg epinephrine injection induces noradrenergic activation that accounts for 25% of the neuronal activity in the LC, 39% in the VLM, and 9.6% in the NTS. Moreover, 24% of the Fos activation in the LC, 33% in the VLM, and 7.1% in the NTS are attributed to activated noradrenergic cells induced by 0.5 mg/kg epinephrine. (B) Activated noradrenergic cell distribution. In the vagus nerve stimulation group, out of the total double labeled cells of the three noradrenergic nuclei, 34% was contributed by the LC, 55% by the VLM, and 11% by the NTS. In the epinephrine 0.1 mg/kg group, 20% was contributed by the LC, 47% by the VLM, and 33% by the NTS. In the epinephrine 0.5 mg/kg group, 24% was contributed by the LC, 47% by the VLM, and 29% by the NTS. (C) A numerical summary of the different activation patterns induced by vagus nerve stimulation or systemic epinephrine injection. The findings indicate that heightened levels of plasma epinephrine and increased vagal activity are capable of affecting in a similar fashion, the cellular activity of noradrenergic neurons and its output areas. Epinephrine injection activates high levels of NTS noradrenergic neurons whereas the vagus nerve stimulation recruits more LC noradrenergic activity. As a consequence, epinephrine injected animals exhibited more cell activation in NTS noradrenergic output areas (CEA, NAC) and vagus nerve stimulation animals showed more cell activation in LC noradrenergic output areas (HIP, BLA).

