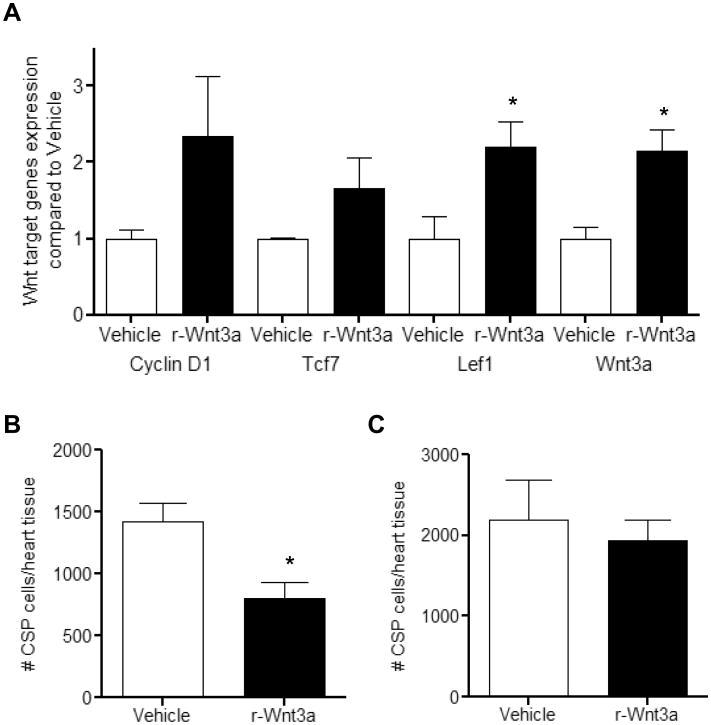
Figure 5. Administration of r-Wnt3a protein decreases the amount of CSP cells following MI.
(A) Gene expression analysis of Wnt target genes (Cyclin-D1, Tcf7, Lef1 and Wnt3a) in the infarct/border zone area (injection site) following intra-myocardial injection of r-Wnt3a protein (n=3). Analysis of CSP cell number 3 days following MI, in (B) the infarct/border zone area (injection site) and (C) the remote areas (atria, septum, right ventricle) of Vehicle or r-Wnt3a injected hearts (Vehicle, n=10 and r-Wnt3a, n=9). Data are mean ± s.e.m. * P≤0.05.

