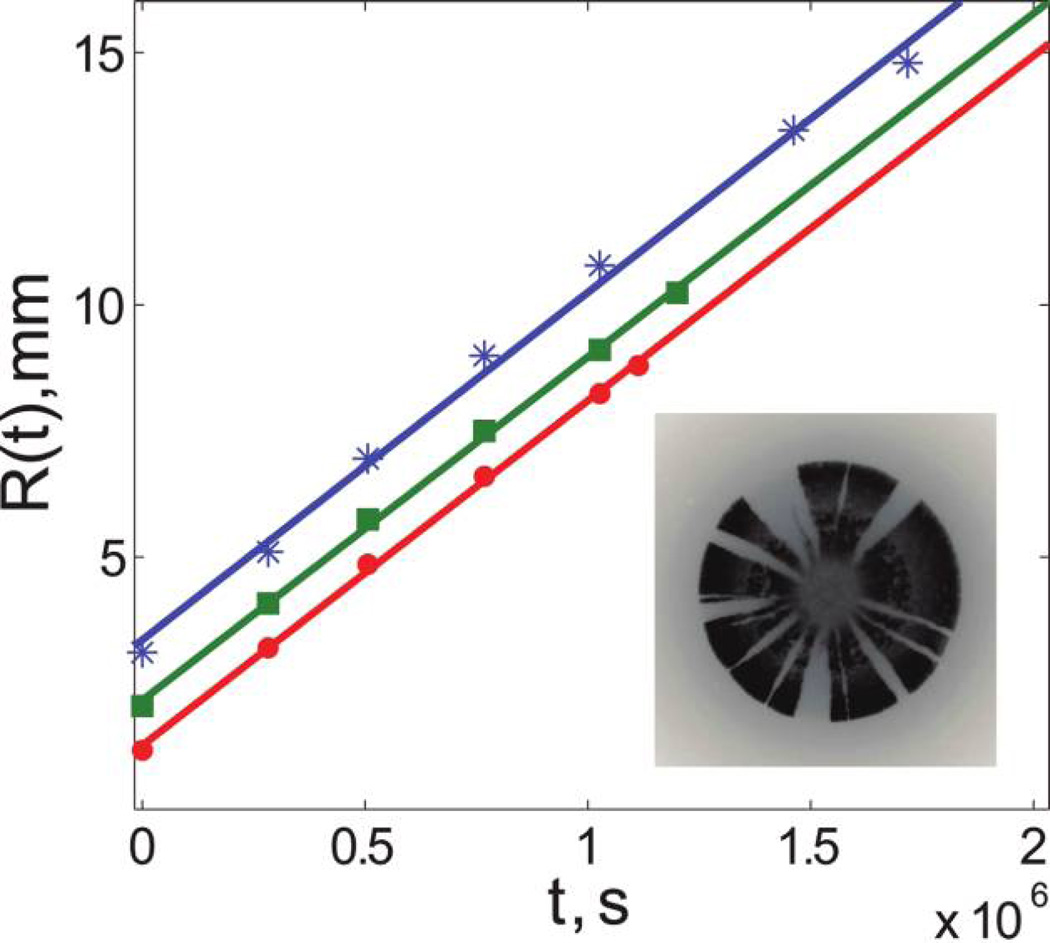
Figure 4.
Linear increase of colony radii with time. The radii of three colonies of Pseudomonas aeruginosa grown at 21°C are plotted as a function of time. The three sets of data correspond to three different inoculation volumes: 1 µL (red dots), 3 µL (green squares), and 14 µL (blue stars). The solid lines are the least square fits to straight lines. For all three colonies, the radius increased linearly with time and the rate of the increase was approximately independent of the initial size of the colony, as would be the case under high-nutrient conditions. Note that for the largest colony the expansion seems to slow down slightly at the end, possibly because of nutrient depletion. Similar behavior was observed for other colonies of P. aeruginosa and Escherichia coli for all growth conditions studied. The obtained values of the expansion velocities are given in table 1. The inset shows a fluorescent image of a P. aeruginosa colony grown at 21°C; fluorescence from only one of the two alleles is shown.

