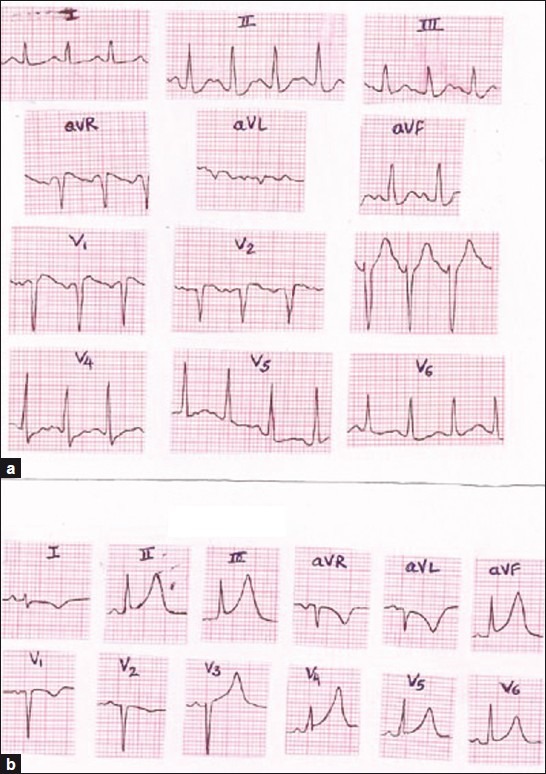
Figure 2.

(a) Electrocardiogram showing sinus tachycardia with secondary “ST-T” changes. (b) ECG on the next day showing normal sinus rhythm with “T”-wave inversions in leads I, aVL, V1 and V2, and ST segment elevation with concavity upward in leads II, III, aVF and V5, and V6
