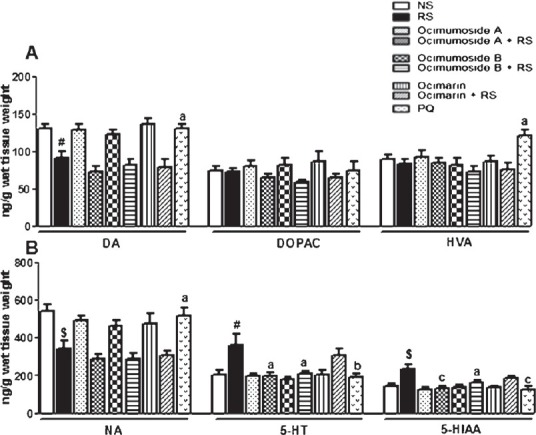
Fig. 3.

Histogram representing the levels of DA, DOPAC, HVA (A) NA, 5-HT and 5-HIAA (B) in the hippocampus of the control (NS), stressed (RS) and OS treated groups. Results are represented as mean ± SEM; (n=8) (ANOVA, Tukey-Kramer post hoc test). #P<0.05, $P<0.01 compared to NS group, aP<0.05, bP<0.01, cP<0.001 compared to RS group.
