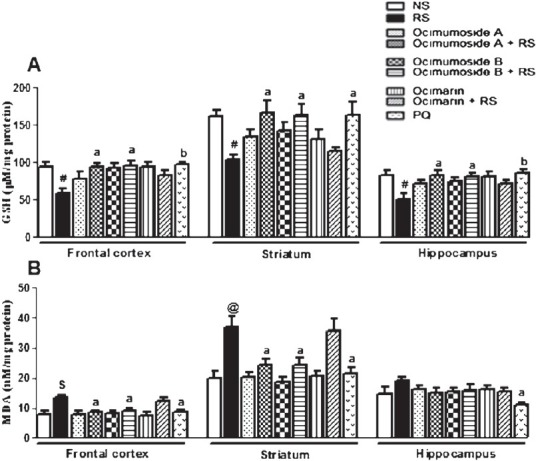
Fig. 5.

Histogram representing the levels of GSH (A) and MDA (B) in the frontal cortex, striatum and hippocampus of the control (NS), stressed (RS) and OS treated groups. Results are represented as mean ± SEM; (n=8) #P<0.05, $P<0.01, @P<0.001 compared to NS group (ANOVA, Tukey-Kramer post hoc test). aP<0.05, bP<0.01, cP<0.001 compared to RS group.
