
. 2012 Apr-Jun;6(2):140–144. doi: 10.4103/1658-354X.97027
Copyright: © Saudi Journal of Anaesthesia
This is an open-access article distributed under the terms of the Creative Commons Attribution-Noncommercial-Share Alike 3.0 Unported, which permits unrestricted use, distribution, and reproduction in any medium, provided the original work is properly cited.
Figure 2.
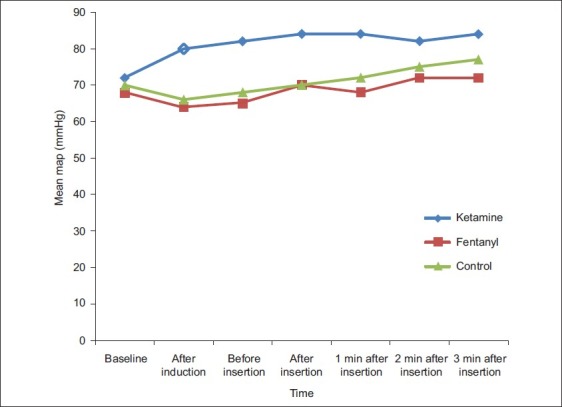
Changes in mean arterial pressure in the three groups