
Table 2.
Postoperative evaluation (n=29)
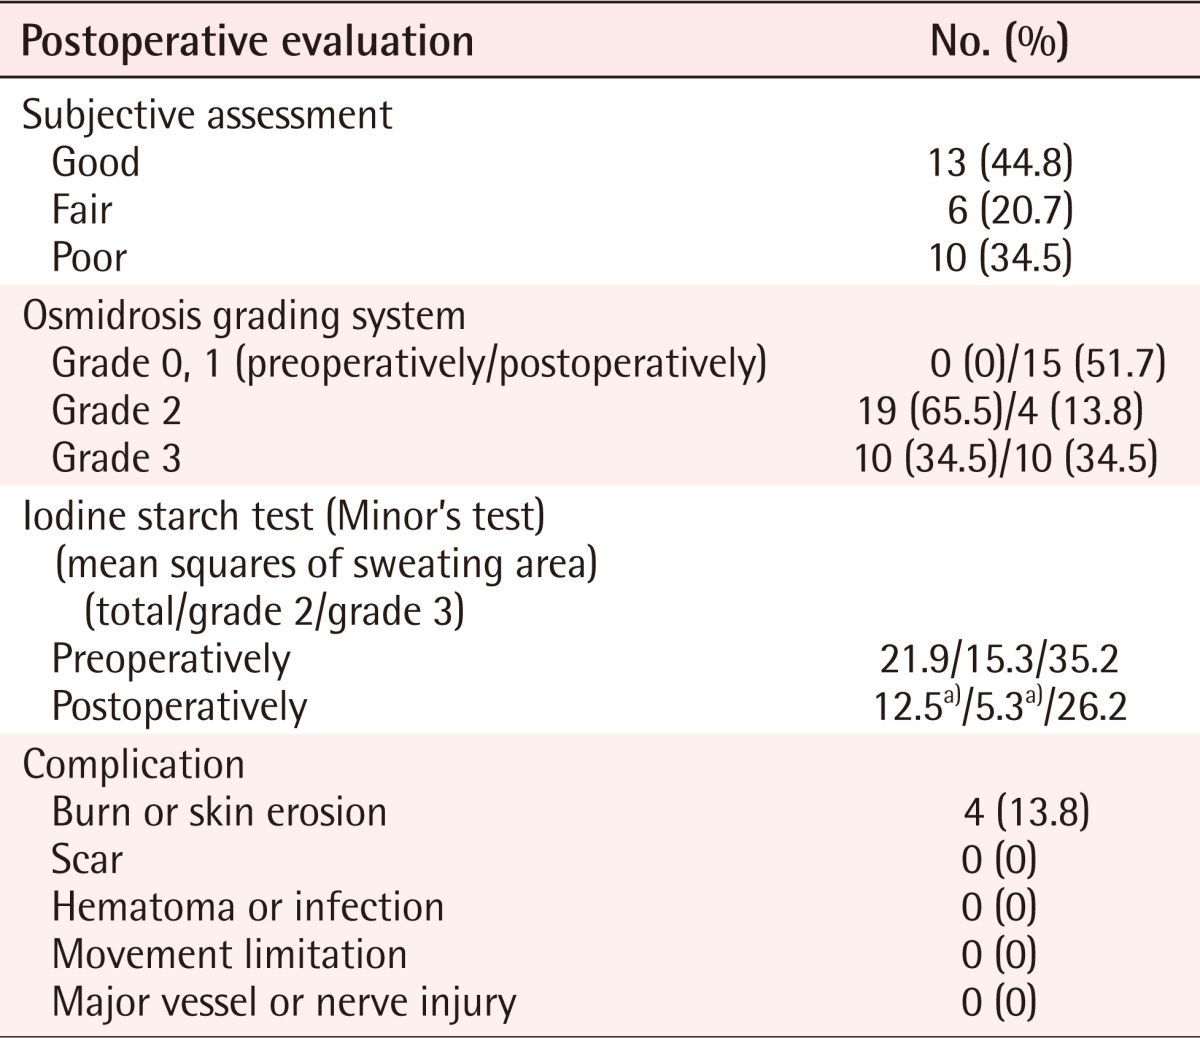
a)P < 0.05; compared with preoperative proportion indices.
Official websites use .gov
A
.gov website belongs to an official
government organization in the United States.
Secure .gov websites use HTTPS
A lock (
) or https:// means you've safely
connected to the .gov website. Share sensitive
information only on official, secure websites.
Postoperative evaluation (n=29)
a)P < 0.05; compared with preoperative proportion indices.